
HOW TO OPERATE
-
Contents
The Maps: Getting Started - How to Use Maps: In-depth
- How to Download
- How to Use Survey Point Map in GIS
The Maps: Getting Started
This section gives you a quick guide to the maps. For more details, see How to Use Maps: In-depth.
Survey Point Map
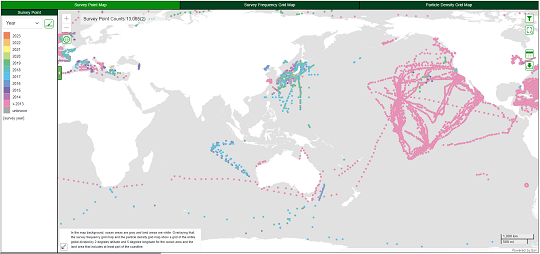
- From MAP / DATA DOWNLOAD in the header, click on Survey Point Map.
-
A map will open that shows survey points for microplastic waste.
The survey points will be color-coded according to the sample collection year, particle density, or particle density rank. -
Click
 to view detailed information for each survey point.
-
Click
 to download detailed information for each survey point.
Survey Frequency Grid Map
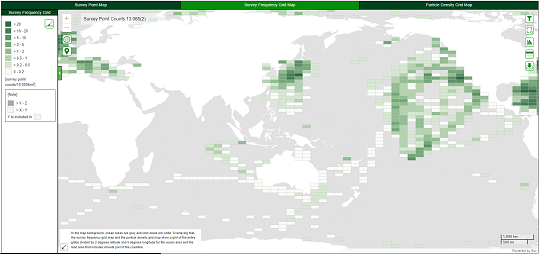
- From MAP / DATA DOWNLOAD in the header, click on Survey Frequency Grid Map.
- A map will open that shows the survey frequency of microplastic waste for each grid (2 degrees latitude by 5 degrees longitude). Areas with higher survey frequencies per unit area will appear darker.
- Select a grid to see the survey point counts for the grid as a time-series chart.
-
Click
 to overlay Survey Point Map on the map.
-
Click to view detailed information for each survey point / grid.
-
Click to download detailed information for each survey point / grid.
Particle Density Grid Map
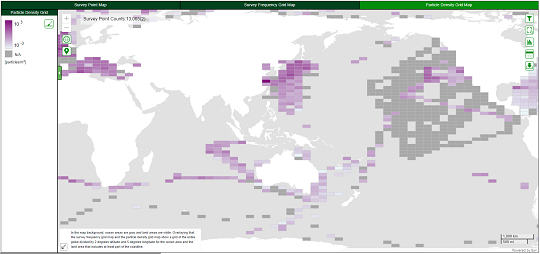
- From MAP / DATA DOWNLOAD in the header, click on Particle Density Grid Map.
- A map will open that shows the aggregated particle density of microplastic waste for each grid (2 degrees latitude by 5 degrees longitude). Areas with a higher average particle density will appear darker.
- Select a grid to see the average particle density for the grid as a time-series chart.
-
Click to overlay Survey Point Map on the map.
-
Click to view detailed information for each survey point / grid.
-
Click to download detailed information for each survey point / grid.
How to Use Maps: In-depth
Map screens and features
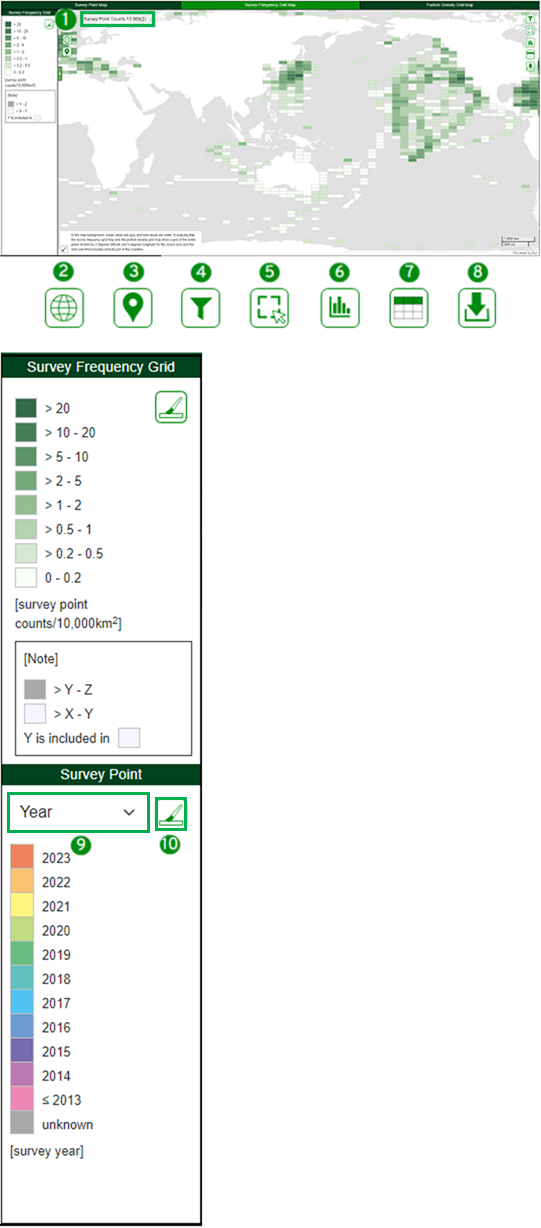
This section shows you key features available on a map screen and how to use them.
-
Survey Point Counts
The number of survey points that match the selected criteria. The default value is the total number of survey points on the map. The count in parentheses represents survey points without location information. -
Graticule toggle icon
When turned on, displays latitude and longitude lines at 10-degree intervals on the map. -
Survey Point toggle icon
When turned on, overlays survey points on the map.
(This icon does not appear in Survey Point Map.) -
Data Select icon
When turned on, opens the Data Select pane, where you can specify and filter the display criteria for data to appear on the screen. -
Range Select icon
When turned on, changes the cursor to allow you to select survey points or grids on the map.
The data for Trend Charts, including the time-series charts of survey point counts and average particle density, are aggregated based on the data of the grid(s) selected on this screen.
Details of the selected data will appear in the Data List pane.
* You can also click and select a single survey point or grid directly on the map.
-
Trend Chart icon
When turned on, opens the Trend Chart pane.
The Trend Chart pane displays a time-series chart of survey point counts or average particle density for the selected grid.
The Trend Chart icon cannot be turned on when no grid is selected. -
Data List icon
When turned on, opens the Data List pane.
The Data List pane displays detailed information for the data currently displayed, as well as for data selected with the Range Select feature. -
Data Download icon
When turned on, opens the Data Download pane.
In this pane, you can download data based on the criteria specified in the Data Select pane. -
Legend selection for Survey Point Map
You can select the legend type from the following for Survey Point Map:
• Year: Color-coded by survey year
• Density: Gradient color-coded according to particle density
• Density Rank: Color-coded by particle density category
-
Change Legend Settings icon
Click the icon to launch the Change Legend Settings pane.
In this pane, you can configure how the map is color-coded.
Changing the legend settings
Click the Change Legend Settings icon on the map screen to configure how the map is color-coded.
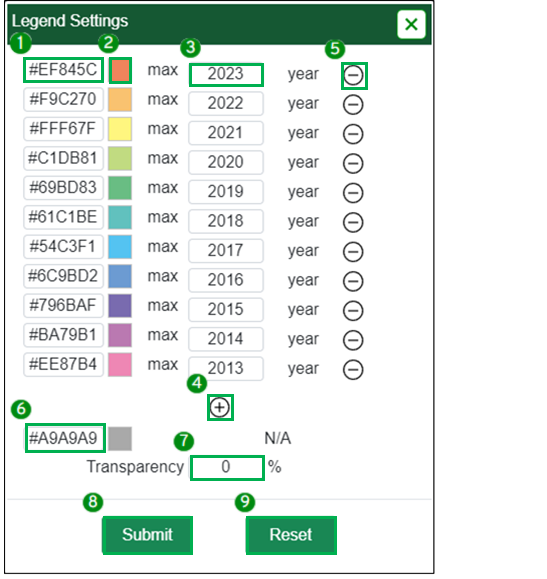
1. Change Legend Settings pane for Survey Point Map (Year)
-
Color code specification
Specify the color that corresponds to the survey year in #RRGGBB format. -
Display color
The color currently specified appears. Click to use the color picker and select another color. -
Survey year
Specify the survey year that corresponds to the color specification. -
Add color setting
Click the icon to add a new color setting. -
Delete color setting
Click the icon to delete the corresponding color setting. -
Color specification for invalid values
Assign a color setting to data with unspecified survey years. -
Transparency setting
Specify the layer color transparency from 0 to 100%. -
Submit
Click the Submit button to apply the changes to the screen. -
Reset
Click the Reset button to revert color configuration to their original state.
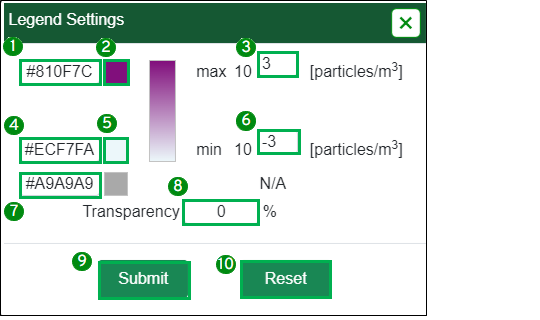
2. Change Legend Settings pane for Survey Point Map (Density)
-
Color code specification (Maximum particle density)
Specify the color that corresponds to the maximum particle density in #RRGGBB format. -
Display color (Maximum particle density)
The color currently specified appears. Click to use the color picker and select another color. -
Maximum particle density value
Specify the maximum particle density value that corresponds to the color specification. -
Color code specification (Minimum particle density)
Specify the color that corresponds to the minimum particle density in #RRGGBB format. -
Display color (Minimum particle density)
The color currently specified appears. Click to use the color picker and select another color. -
Minimum particle density value
Specify the minimum particle density value that corresponds to the color specification. -
Color specification for invalid values
Assign a color setting to data with unspecified survey years. -
Transparency setting
Specify the layer color transparency from 0 to 100%. -
Submit
Click the Submit button to apply the changes to the screen. -
Reset
Click the Reset button to revert color configuration to their original state.
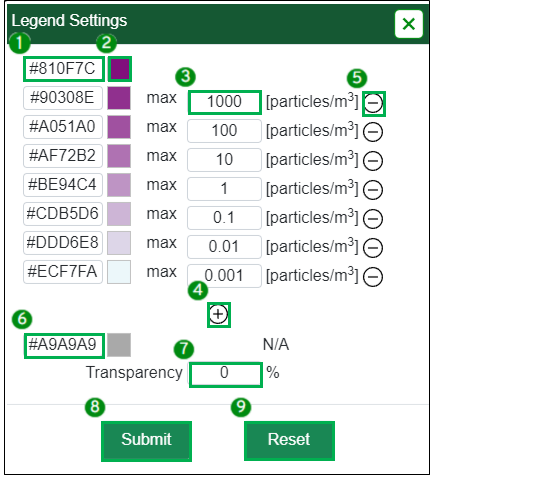
3. Change Legend Settings pane for Survey Point Map (Density Rank)
-
Color code specification
Specify the color that corresponds to the particle density in #RRGGBB format. -
Display color
The color currently specified appears. Click to use the color picker and select another color. -
Particle density value
Specify the particle density value that corresponds to the color specification. -
Add color setting
Click the icon to add a new color setting. -
Delete color setting
Click the icon to delete the corresponding color setting. -
Color specification for invalid values
Assign a color setting to data with unspecified particle density values. -
Transparency setting
Specify the layer color transparency from 0 to 100%. -
Submit
Click the Submit button to apply the changes to the screen. -
Reset
Click the Reset button to revert color configuration to their original state.
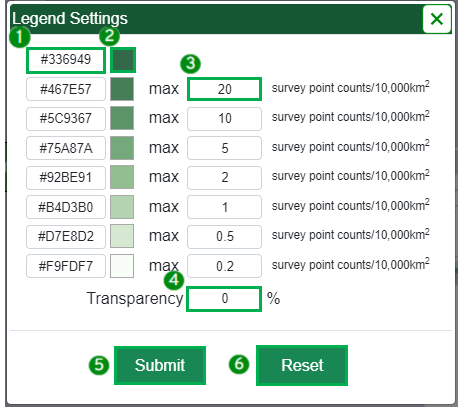
4. Change Legend Settings pane for Survey Frequency Grid Map
-
Color code specification
Specify the color that corresponds to the survey frequency in #RRGGBB format. -
Display color
The color currently specified appears. Click to use the color picker and select another color. -
Survey frequency value
Specify the survey frequency value that corresponds to the color specification. -
Transparency setting
Specify the layer color transparency from 0 to 100%. -
Submit
Click the Submit button to apply the changes to the screen. -
Reset
Click the Reset button to revert color configuration to their original state.
5. Change Legend Settings pane for Particles Density Grid Map
-
Color code specification (Maximum particle density)
Specify the color that corresponds to the maximum particle density in #RRGGBB format. -
Display color (Maximum particle density)
The color currently specified appears. Click to use the color picker and select another color. -
Maximum particle density value
Specify the maximum particle density value that corresponds to the color specification. -
Color code specification (Minimum particle density)
Specify the color that corresponds to the minimum particle density in #RRGGBB format. -
Display color (Minimum particle density)
The color currently specified appears. Click to use the color picker and select another color. -
Minimum particle density value
Specify the minimum particle density value that corresponds to the color specification. -
Color specification for invalid values
Assign a color setting to data with unspecified survey years. -
Transparency setting
Specify the layer color transparency from 0 to 100%. -
Submit
Click the Submit button to apply the changes to the screen. -
Reset
Click the Reset button to revert color configuration to their original state.
Selecting data for display
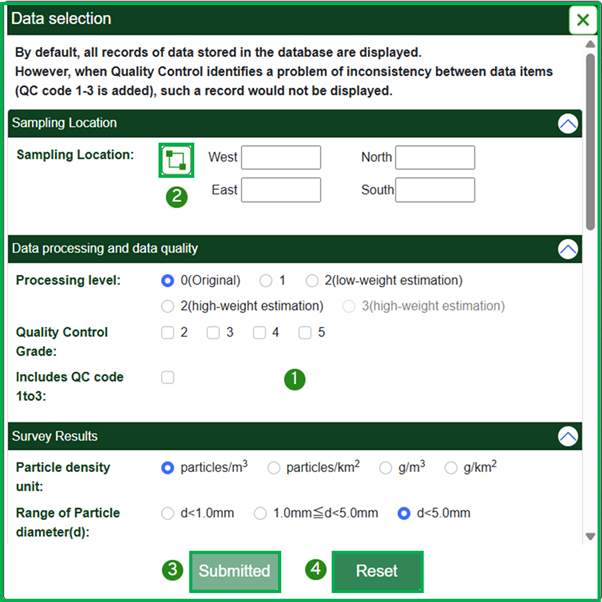
Click the Data Select icon on the map to specify the display criteria for specific data to appear.
-
Data Select pane
Turn on icon on the map screen to launch the Data Select pane.
You can filter the following data based on the set of criteria specified on the Data Select pane:
• Data to appear on the map
• Data to appear in the Data List
• Data to appear in the Trend Chart pane
• Data to be downloaded in the Data Download pane
See Table: List of Criteria Specifiable in the Data Select Pane to see what parameters you can specify for your criteria.
* Depending on the processing level you choose, the range of possible values for other parameters may vary. -
Area selection
Click the icon to change the cursor to allow you to select a rectangular area on the map.
The latitude and longitude of the rectangular area selected will be set as survey criteria. -
Submitted / Submit
Click this button to filter the data.
The button becomes active when you have entered or changed a criteria value. -
Reset
Click this button to revert the criteria to the original values.
Table: List of Criteria Specifiable in the Data Select Pane
| Category | Parameter | Descriptions |
|---|---|---|
| Data processing and data quality |
Processing level |
Data correction status and level of correction, represented by one of the following values: 0 (Original Data): Data uncorrected 1: Data with fibrous particles excluded 2 (High-weight estimation): 2 (Low-weight estimation): 3 (High-weight estimation): |
| Quality Control Grade |
The Quality Control Grade. QC grade 1: Data received (no quality control) QC grade 2: Data with codes for quality control QC grade 3: Data include all fundamental data items QC grade 4: Data include all essential data items QC grade 5: Harmonized data In detail, please refer to Quality Control. |
|
| Includes QC Code 1to3 | Specifies whether data containing values from 1 to 3 in the QC Code of the data provided will be included for display. | |
| Survey Results | Particle density unit | The unit of particle density. Legends and Trend Charts will be displayed in the specified particle density unit. |
| Range of Particle diameter (d) |
The range of particle sizes to be included in the display. Particle density corresponding to the specified particle size category will be used in Legends and Trend Charts. |
|
| Particle density range | The range of particle density to be included for display. | |
| Survey Conditions | Sampling Date | The date of the survey. It refers to the start date of sample collection. |
| Sampling Location | The coordinates (WGS84) at the start of sample collection. | |
| Equipment Type | The name of the equipment used for sample collection. | |
| Mesh opening[mm] | The length of an opening of the net. Knots are not included in the measurements. |
|
| Sampling area [m2] | The surface area of the sea covered during trawling. It is generally the width of the sample collection opening, multiplied by the trawl distance. Unit: square meters (m2). |
|
| Filtered Water Volume[m3] | The volume of seawater filtered or collected. For sample collection from the sea surface by trawling, it is the width of the sample collection opening, multiplied by the trawl distance, multiplied by the depth of the lower end of the sample collection opening. Unit: cubic meters (m3). |
|
| Wind speed[m/s] | The wind speed at the time of sample collection. Unit: meters per second (m/s). |
|
| Significant wave height[m] | The significant wave height at the time of sample collection. Significant wave height is the average measurements of the highest one-third of the waves observed. Unit: meters (m). |
|
| Beaufort scale | The classification indicating the force of wind at the time of sample collection. The scale ranges from 0 to 12, with smaller numbers representing calmer sea conditions. |
|
| Source | Organization type | The classification of the organization as a data provider. |
| Published in a paper | Indicates whether there is a reference source for this data record. | |
| Keyword search (author, title, journal) of published papers |
Specifies the author, title, journal, etc., for searching reference sources. | |
| DOI registration | Indicates whether there is a DOI (Digital Object Identifier) for the reference source. |
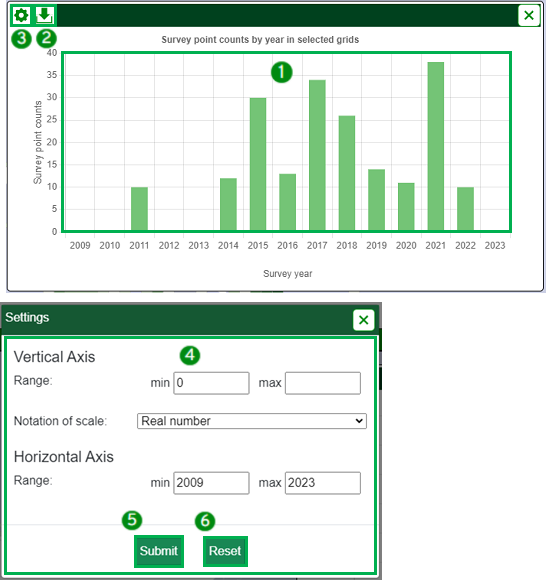
Trend Charts
Click the Trend Chart icon to view the time-series chart for the grid selected.
-
Trend Chart pane
Turn on on the map screen to launch the Trend Chart pane.
The time-series chart of survey point counts for the selected grid will appear on the Survey Frequency Grid Map.
The time-series chart of average particle density for the selected grid will appear on the Particle Density Grid Map. -
Downloading data
Click the icon to launch the Data Download pane.
You can download the time-series chart in the Data Download pane. -
Trend Chart settings
Click the icon to launch the Trend Chart Settings pane. -
Trend Chart Settings pane
In this pane, you can configure the following settings for the Trend Chart:
• Minimum/maximum values on the horizontal axis of the graph
• Minimum/maximum values on the vertical axis of the graph.
• Type of vertical axis (linear axis / logarithmic axis). -
Submit
Click the Submit button to apply the changes to the Trend Chart. -
Reset
Click the Reset button to revert the settings to their original state.
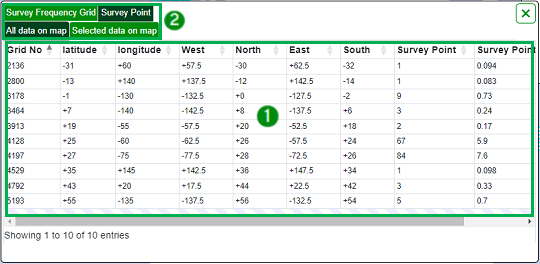
Detailed data information
Click the Data List icon to view details for the data displayed or selected.
-
Data List pane
Turn on on the map screen to launch the Trend Chart pane.
-
Data tabs
Detailed data for the tab selected on the first level in the tab stack will appear.
On the second level in the tab stack, choose "All data on map" tab to view all the data on the map, or "Selected data on map" to view the selected data only.
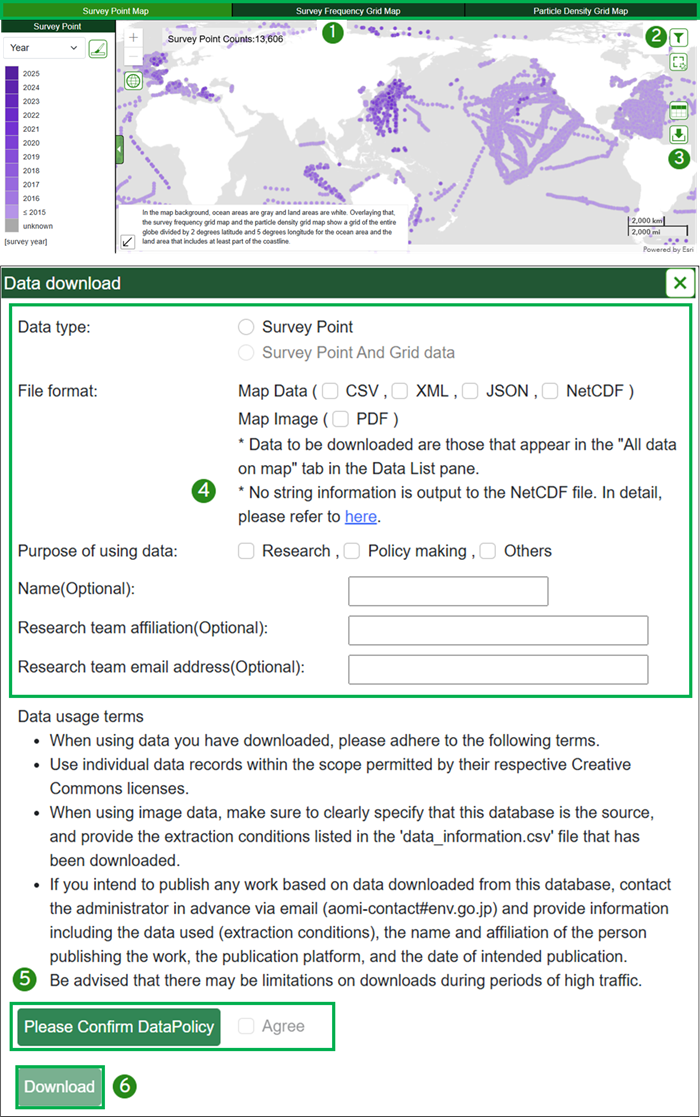
How to Download
Downloading displayed data
This section shows you how to download the data that is being displayed on a map screen.
-
Open the map that provides the data you want to download.
• Detailed information for a survey point: Survey Point Map
• Survey frequencies per grid: Survey Frequency Grid Map
• Particle density per grid: Particle Density Grid Map -
Turn on on the map screen and specify the criteria for data to be downloaded.
When downloading particle density data, note that the value and unit of the particle density in the downloaded data may vary depending on the selections you make in "Particle density unit" or "Range of Particle diameter (d)."
List of Criteria Parameters Specifiable -
Turn on on the map screen.
- Select at least one option each for the data type, file format, and purpose of use for the data to be downloaded.
- Review the Data Policy, and check "Agree" if you agree to them.
- Click the Download button to start downloading the data.
How to Use Survey Point Map in GIS
This section shows you how to use Survey Point Map as a Web Map Service (WMS) or Web Feature Service (WFS) in QGIS.
The following instructions are based on QGIS version 3.28.0.
Using WMS in QGIS
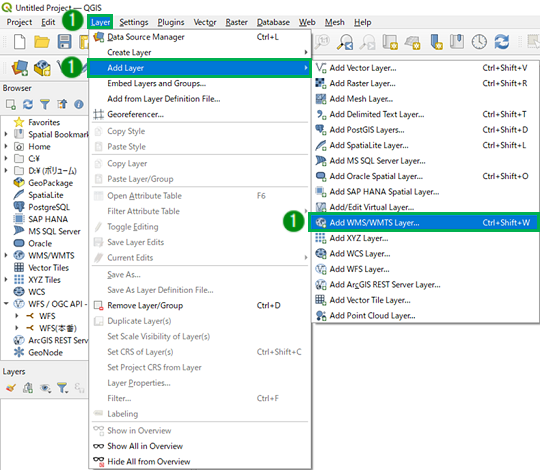
- Launch QGIS and click on "Layer" -> "Add Layer" -> "Add WMS/WMTS Layer" in sequence.
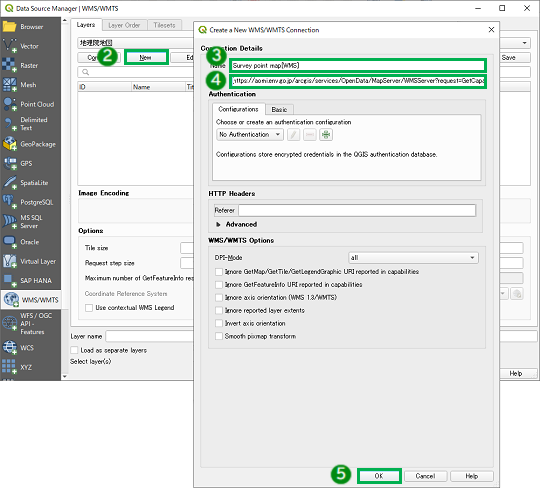
The "Data Source Manager" window will open. - Click "New" to open the "Create a New WMS/WMTS Connection" window.
- In the "Name" field, enter a name of your choice.
- In the "URL" field, enter the following URL for the WMS service:
https://aomi.env.go.jp/arcgis/services/OpenData/MapServer/WMSServer?request=GetCapabilities&service=WMS - Click "OK."
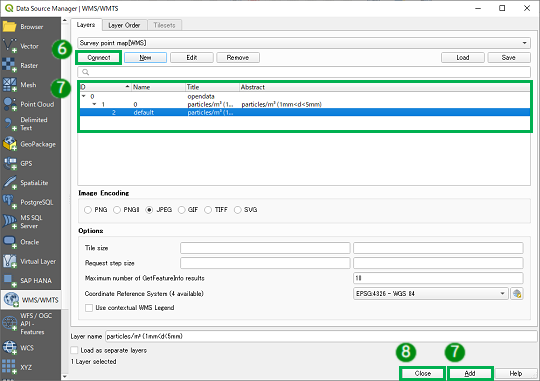
- In the "Data Source Manager" window, click "Connect" to retrieve information from the server.
A list of retrieved layers will appear. - Select the layer you want to add from the list of layers and click "Add."
- Click "Close."
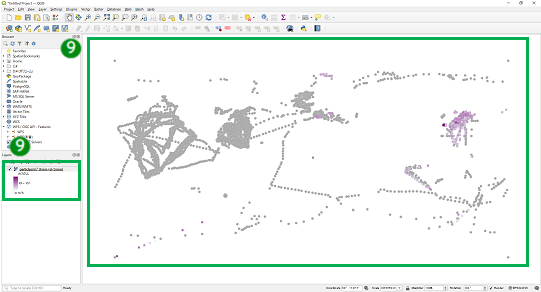
- The selected layer, along with Legends color-coded according to the particle density, will appear.
Using WFS in QGIS
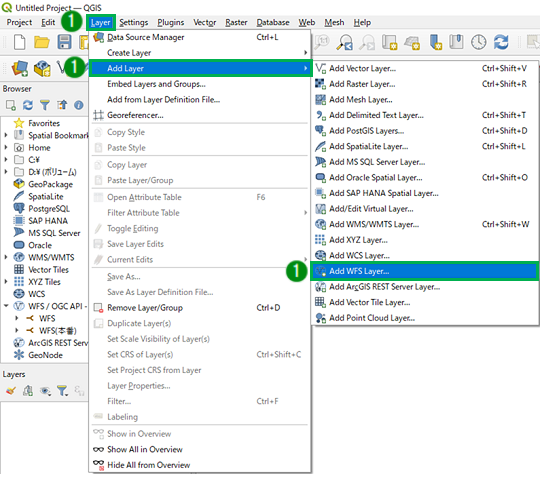
- Launch QGIS and click on "Layer" -> "Add Layer" -> "Add WFS Layer" in sequence.
The "Data Source Manager" window will open. - Click "New" to open the "Create a New WFS Connection" window.
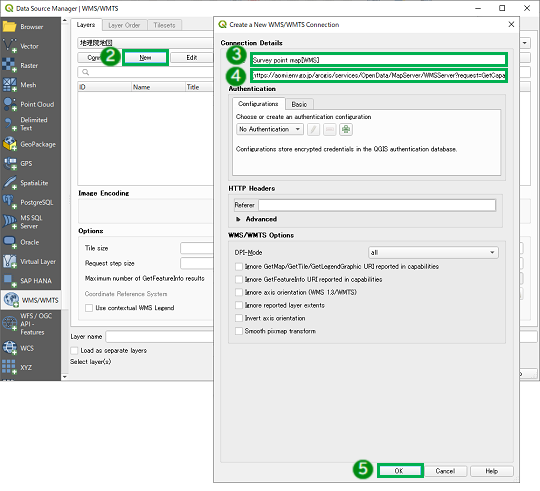
- In the "Name" field, enter a name of your choice.
- In the "URL" field, enter the following URL for the WFS service:
https://aomi.env.go.jp/arcgis/services/OpenData/MapServer/WFSServer?request=GetCapabilities&service=WFS - Click "OK."
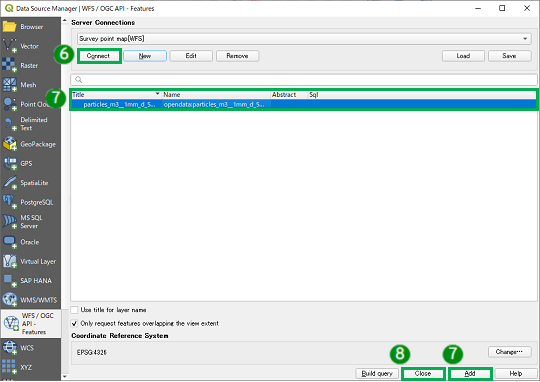
- In the "Data Source Manager" window, click "Connect" to retrieve information from the server.
A list of retrieved layers will appear. - Select the layer you want to add from the list of layers and click "Add."
- Click "Close."
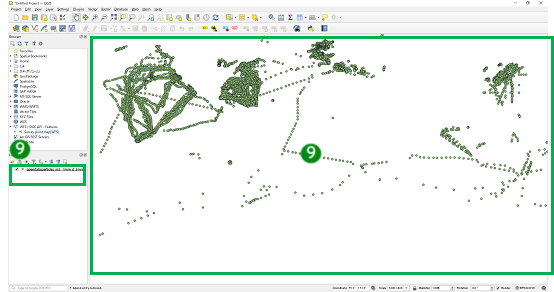
- The selected layer will appear.