
Welcome to the Atlas of Ocean Microplastics
Global distribution map of marine plastic litter
ABOUT
WEBSITE
This website is a database of monitoring and observation data on ocean microplastics provided by researchers, research institutes, and governments from around the world. Based on the data, this database provides 2D maps of survey points (or location) and particle density distribution around the globe.
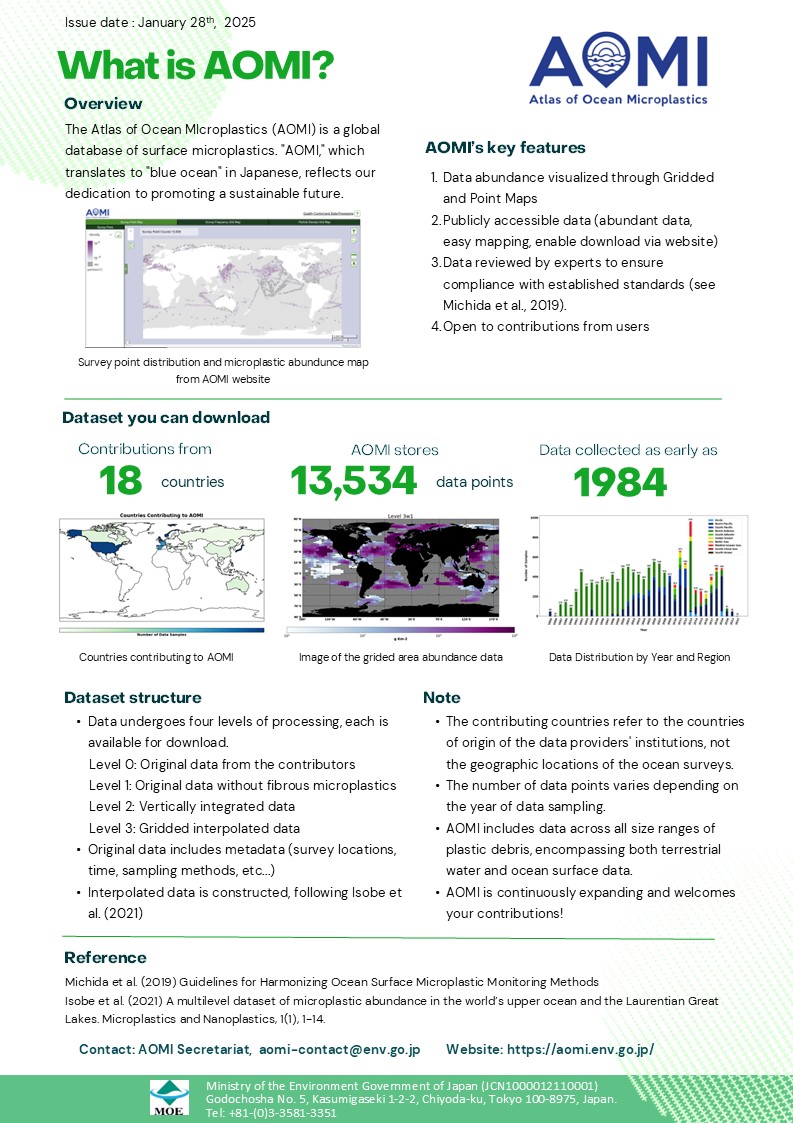
What is AOMI?
The Atlas of Ocean MIcroplastics (AOMI) is a global database of surface microplastics. Named after the Japanese term for "blue ocean," it represents our commitment to a sustainable future.
Download the leaflet "What is AOMI?" for key features, or read below for more details
Background
To combat marine plastic pollution, collecting monitoring data on ocean surface microplastics and sharing microplastic distribution globally.
Marine litter, including microplastics, is an urgent global issue. Understanding the existing distributions and quantities of microplastics in the ocean is a vital first step towards solving this problem. Since G7 Summit 2015 in Schloss Elmau and the G20 Osaka summit 2019, the harmonization of microplastics monitoring methods and global integration of observation/monitoring data have been in progress.
AOMI collect and store data on ocean surface microplastics provided by researchers, research institutions and governments around the world. The data, including microplastics particle density results, are organized according to "Guidelines for Harmonizing Ocean Surface Microplastic Monitoring Methods" to improve data comparability and promote higher level analysis of microplastic issues and application to policy development.
All data provided in AOMI are quality-controlled and AOMI has functions for extracting comparable data, 2D map display, advanced correction data based on the latest scientific findings and its 2D maps, etc. for free of charge to users.
About AOMI
Open database of ocean surface microplastics on survey location and density distribution across the globe
1.Open access to globally aggregated data
AOMI records research and analysis of ocean surface microplastics across the globe and compiles the results into a database.
Users can view and download all data for free, and filter the data according to their own purposes and uses.
2.Availability of comparable data
ALL data in AOMI quality controlled. As a part of quality control procedures, a comparability grade is added to each data according to the Guidelines for Harmonizing Ocean Surface Microplastic Monitoring Methods, developed in collaboration with experts from different countries. In addition to original uncorrected data, AOMI also provides data scientifically corrected for effects of the uneven distribution of survey points.
3.Visualized information
AOMI visualizes the survey points and distribution of ocean surface microplastics around the globe as 2D map. Providing data in an easily comprehensible manner would make it easier to track progress of global countermeasures against marine plastic litter.
4.Contribution to the establishment of an international network
AOMI collaborates with databases created by international organizations, programs, and other countries.
AOMI will contribute to building global networks and systems that cooperate in promoting harmonized methods and data to understand the state of marine plastics pollution.
Data Contents
Data registered in AOMI is scientifically organized in accordance with the "Guidelines for Harmonizing Ocean Surface Microplastic Monitoring Methods"
Field Survey
Data on the method for and conditions during sampling ocean surface microplastics in the seas: e.g., research vessels, sampling date, locations, weather and sea conditions, equipment type, and methods used.
Laboratory Analysis
Data on the method for and conditions during the laboratory analysis of samples collected: e.g., use of biological digestion and chemical treatment, methods for counting and measuring sizes of particles, and techniques for the identification of microplastics.
Results of Data Analysis
AOMI classifies microplastic data into four distinct size categories:
- Diameter less than 1 mm (d < 1 mm)
- Diameter between 1 mm and 5 mm (1 mm ≤ d < 5 mm)
- Diameter less than 5 mm (d < 5 mm)
- Diameter greater than 5 mm (d ≥ 5 mm)
For microplastics categorized as smaller than 1 mm, there is no minimum size restriction. This means that microplastics smaller than 300 μm, collected using methods such as bottle sampling, can be shared with the AOMI database and are also available for download.
AOMI contains microplastics abundance data in various forms (as of December 2024), including:
- Total Number of Particles
- Particle Density (particles/m³)
- Particle Density (particles/km²)
- Total Weight (g)
- Weight Density (g/m³)
- Weight Density (g/km²)
AOMI aims to expand and include more detailed information, such as shape categories, material types, and color categories for microplastics categorized larger than 5mm, in future updates※.
Data in AOMI --- Data Seet / 2D Map (as of Dec. 2024 )
| Upload/Download with the Data Sheet | 2D Map | ||
|---|---|---|---|
Abundance data
|
Form data
|
||
| Diameter less than 1 mm (d < 1 mm) | ○ | ○ | ○ |
| Diameter between 1 mm and 5 mm (1 mm ≤ d < 5 mm) | ○ | ○ | ○ |
| Diameter less than 5 mm (d < 5 mm) | ○ | ○ | ○ |
| Diameter greater than 5 mm (d ≥ 5 mm) | ○ | Not possible※ | Not possible |
In addition to surface water data, AOMI supports water column data as well. To contribute data from a specific water column, please provide the column depth information in the data entry form. If a net was used, please ensure that the net mouth height (referred to as "the thickness of the net" in the entry sheet) is included for accurate depth measurements.
Guidance on Data Maps
Three types of maps are available.
Survey Point Map
What is Survey Point Map?
This is a map showing the location where the survey was conducted. Field Survey data is collected to create this map.
Features
Each site can be represented by the sampling year and the particle density of at the site.
Users can extract data to be displayed or downloaded on the map through selecting from given conditions. Addtitionally, users can choose color legend on the map.
Survey Frequency Grid Map
What is Survey Frequency Grid Map?
This is a grid map showing the number of surveys conducted for each grid (2 degrees latitude x 5 degrees longitude) and displaying the data collected from Field Survey as survey density.
Features
The grid map legend is displayed in a gradient according to the number of surveys conducted. Users can choose colors to display, the color of the gradient, and the range of the scale.
Also, users can select any specific grid on the map and display the Graph of Survey Frequency by Year.
Particle Density Grid Map
What is Particle Density Grid Map?
This is a grid map displaying the particle density for each grid (2 degrees latitude x 5 degrees longitude).
This map shows Field Survey and Results data.
Different calculation methods are applied to the particle density displayed on the Particle Density Grid Map, depending on the level of data processing.
Features
Particle density can be displayed in the following particle sizes and units.
Particle size: d < 1.0 mm, 1.0 ≦ d < 5.0 mm, or d < 5.0 mm
Units: particles/m³, particles/km², g/m³, or g/km²
The grid map legend is displayed in a gradient according to the aggregated particle density. Users can choose the colors to display, the color of the gradient, and the range of the scale.
Also, users can select any specific grid on the map and display the Graph of Particle Density by Year, which averages particle density by sampling year.
Data Download
Users have free and unlimited access to all data registered with AOMI. Downloaded data shall be used in accordance with data policy.
Available data formats;
Text data (CSV, XML, JSON, NetCDF), Image data (PDF)
Data Upload
This database is built thanks to the data provided by researchers, research institutes, and governments from around the world.
Your cooperation in providing data from field surveys would be greatly appreciated. See 'How to provide data', for data format and detailed procedures for providing data.
TERMS OF USE
The Terms of Use (hereinafter referred to as the "TOU") apply to the services provided in the AOMI (hereinafter referred to as the "Services"). By using the Database, users of the Services shall be deemed to agree to the TOU.
Click here for more-
Disclaimer
(1) Appropriate caution is necessary for interpreting data obtained from the Database.
Database users should be aware that the obtained data set may contain errors, and should be cross-checked before use.
(2) The Database Administrator takes no responsibility for the quality and contents of the data, data products, or work products based on data obtained from the Database, or their use or misuse. -
Conditions of Use
Documents, images and other data provided in the Database shall be subject to change or deletion without notice.
Database Users shall prepare, at their own responsibility and expense, the devices, software, communication lines and other equipment required to use this database. -
Amendment of the TOU
The Database Administrator reserves the right to amend the TOU at any time without prior notice.
-
Privacy Policy
The Database Administrator shall not publicize or provide personal information on the data users obtained through the use of this website or the Services to any third party without the consent of the data user.